A private operations dashboard
A dashboard built for one operator, to see what the live site is actually doing rather than what its configuration says it should.




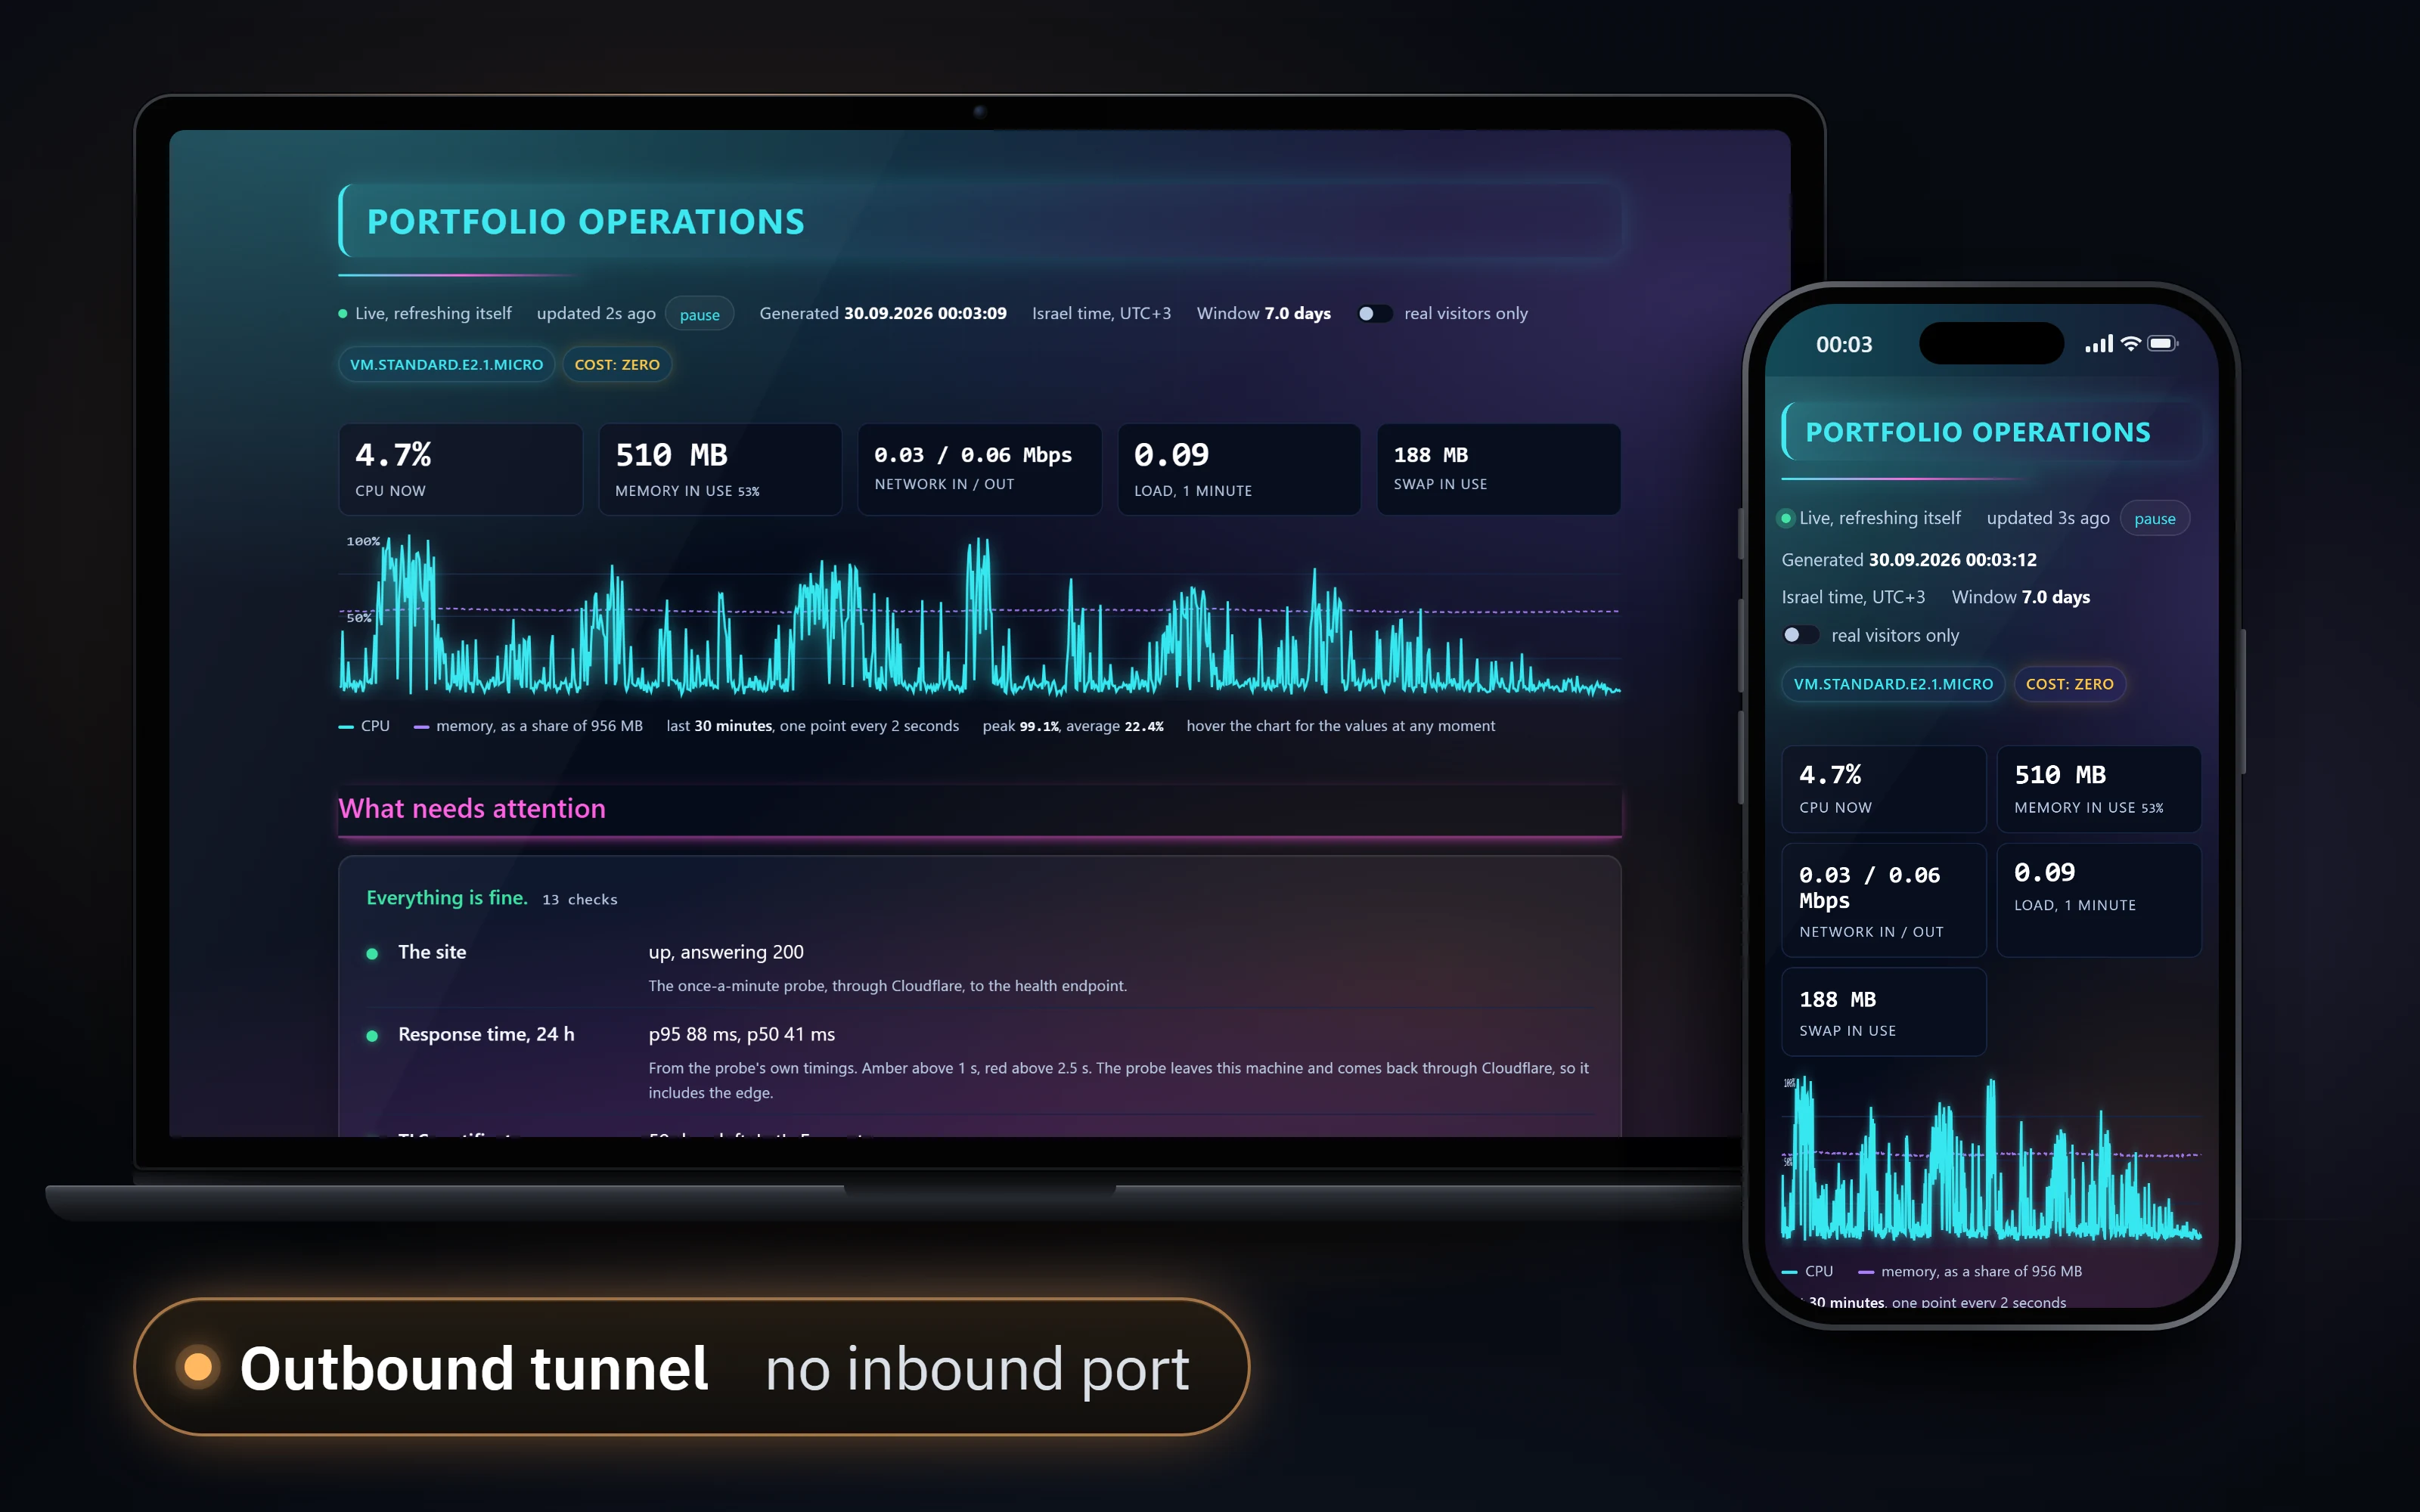
Running a site means answering one question over and over: is it doing what I think it is doing. A configuration file answers a different question, which is what it was told to do. Every problem this site has had has lived in the gap between those two.
So there is a dashboard, built for one operator, that reports the live state rather than the intended one. It is not a public artefact, and this page describes what it does and what guards it rather than what it shows, which is the ordinary way to write about internal work rather than a concession.
What guards it: it is not exposed to the internet. There is no inbound port for it and no public address. It is reached over an outbound-only tunnel, behind an identity check at the edge and then a password. Because the tunnel is established outward by the host, there is nothing listening for a stranger to find.
It exists because several faults on this site were caught by looking at what the system actually returned rather than at what its configuration claimed it would. A dashboard that reports measurements instead of settings is that habit turned into a tool.
What I would do differently: decide what counts as a real reading before collecting any. Its first CPU sample was the setup script measuring itself, a 48% spike that would have sat in the weekly chart for seven days, and it called a healthy stack degraded the day a fourth container appeared.